Facts are stubborn things. In aviation, they are presented as truths, but without a full explanation they can be easily misleading. We see them in every form of media, and I myself have gone on television and shared some of my favorite factoids for sound bites. But what do those stats truly mean?
That’s not to say that the stats and facts that get tossed around are wrong, but they are often incredibly interpretive. The words used often don’t allow you to do the reverse math back to its origins, making the logic equation fail and the “fact” then becomes debatable mush. I’d like to break down some of those facts, stats and phrases for you, and maybe come up with some new ones of our own.
Safety in numbers
For now, almost all of my stats are going to pertain to the United States. This is not American egotism, but merely about access to statistics, and using the United States as a microcosm for air travel. There are many countries that have strong safety records, and traveling outside of the U.S. does not necessarily imply statistics from elsewhere are different from this.
First, it is important to say that these stats are for passenger airlines. They do not include charter, general aviation, military, air show or air race accidents. This is because a majority of discussions on plane crash stats are in reference to common airline passenger travel. I am a huge proponent of the push for more education to come about from cargo airline crashes, which offer lessons that we can use in passenger airlines, but for the sake of explaining to people their own safety in their own regular travel, we will stick with passenger airline statistics.
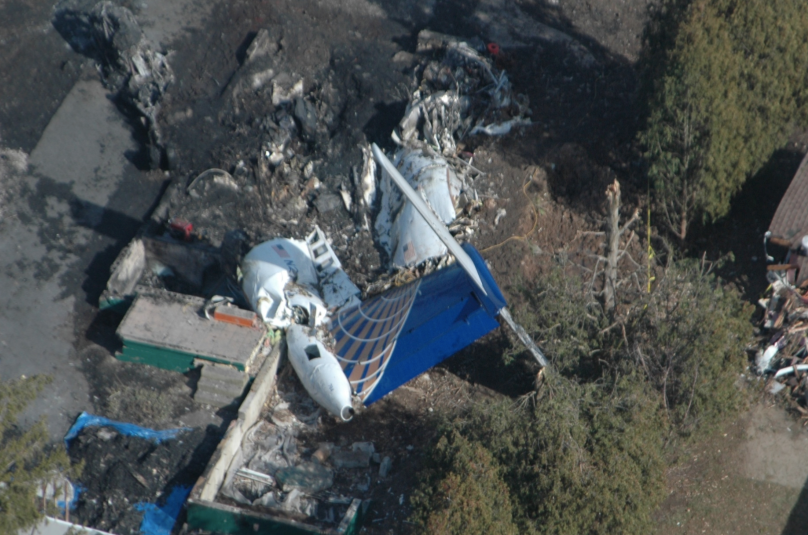
Colgan Flight 3407 was the deadliest airline accident on American soil in the last decade, killing 50 people. Lessons learned led to several new regulations that are expected to save lives by preventing future accidents.
Next, let’s figure out the average of how many people die in airline crashes in the United States each year. We already have a conundrum, because how many years fairly represent that number with so few fatal accidents in total? New regulations, newer aircraft, different training and improvements that are constantly being made after learning from past accidents make it safer and safer each year. So, going too far back in time can make the data very misleading and outdated. Let’s try anyway.
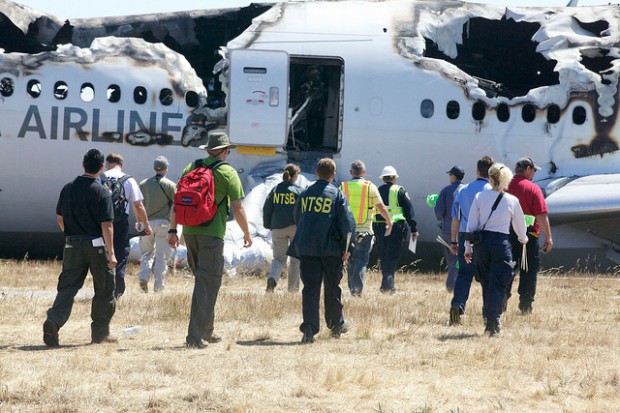
Last year, no one died in an airliner crash in the U.S. It’s tough to compare 0 to any number mathematically so as to come up with a tangible result, so in order to get something more measurable, let’s look at the last 5 years to get a better average. That leaves only Asiana Flight 214 with 3 fatalities, giving us an average of .6 fatalities per year. That’s still a fairly tiny number to compare. But if we back it up further to 10 years, we might then be including what many may consider to be a different era of airline safety. Either way, in the last 10 years, 102 people have died from airline crashes in the US (adding Comair Flight 5191 and Colgan Flight 3407 to the mix).
For comparison, let’s first look at overall total fatalities.
World population: 7 billion
Daily worldwide fatalities (all causes): 150,000+
United States population: 318 million
Daily United States fatalities (all causes): 6,800
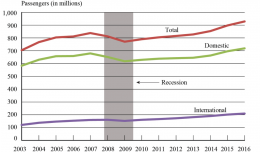
Airline passengers in the U.S. over the last 5 years: 4 billion
Airline passenger fatalities in the U.S. over the last 5 years: 3
Average daily airline passenger fatalities in the U.S.: 0.0003
That is 3 ten thousandths of a person that dies per day in an airline crash, by the way, using the .6 per year average from the last 5 years. If we change to the 10-year average, that number “skyrockets” to 0.002 airline fatalities per day.
What does this mean? No real sound bites here, but just some big numbers to maybe give you a perspective of the size of the world, the country and how few airline fatalities there are.
Lightning Round!
I have often told facts comparing plane crashes to lightning strikes. People often use lightning strikes to reference things that are incredibly rare, so I thought it’d be a good thing to compare airline crashes to. I did the math on this years ago, and looking back on more data, I find out that was I misleading. In fact, I was low-balling it. It’s even safer than I thought!
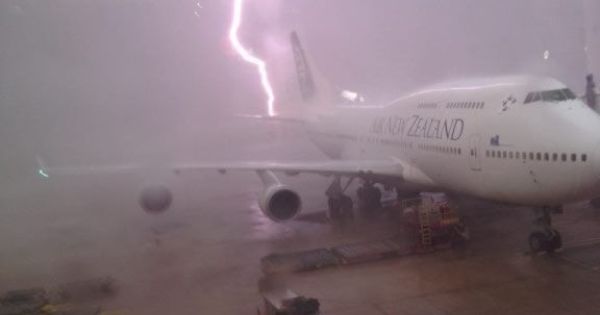
Don’t get me started on the odds of getting struck by lightning while actually on an airplane.
According to the National Weather Service, 267 people are hurt from lightning strikes each year. So I could easily say that you are more than 26 times likely to get struck by lightning than to die in an airline crash…and that is using the higher 10-year annual airline death average of 10! Using the 5-year average, I could say you’re 445 times less likely to die in an airline crash than to be struck by lightning.
I could go on television and share either of those facts, and technically I would be right on both counts. But without sharing a frame of reference, they are just words in a cool sound bite. Though I could explain it all if questioned, it shows how the true data can be manipulated. It’s all interpretive.
You can take that to the bank…in a car…or should you?
I am just as guilty as the next guy of using the old phrase “The most dangerous part of flying is the drive to the airport.” Is it true? Yes, it is, but I’d like to put my money where my mouth is. But where do you start? It gets tricky in a hurry.
When comparing driving to flying, should I go with the total number of people who drive versus those that fly? What about people who ride in cars instead of actually driving them (like kids in a school bus)? Maybe we can look at total instances of driving (to work, to the store, to the gym, back home…..that’s several drives in one day)? The data is all debatable on how it compares back to flying, and people have been debating the driving vs. flying safety stats for so long; I’ve seen the internet arguments, and they aren’t pretty.
For the sake of finding something people can relate to, let’s compare air travel to a typical, daily commute, of which 90% of Americans do by car.
Total Americans who commute by car daily: 286 million
Total daily airline passengers in the US: 2.2 million
Daily auto fatalities in US: 90
Daily airline fatalities in US: 0.0003
Adjusted for comparison, if the same amount of people that drove to work each day also flew, the daily amount of airline fatalities would be 0.03. Three hundredths of a person is like a pinky toe each day, and that is still using the 5-year average. Bring it up to the 10-year average, and that daily total would become 2.6.
With the 2.6 result, someone may go ahead and say “Driving is 34 times more dangerous than flying,” But, that’s misleading, as there is no explanation as to what “dangerous” means. More words should be applied.
Since I feel the 5-year average is fair, I would have no problem saying to the public, “Looking at the last five years, if as many people who drove to work also flew each day, you’d be 30 times more likely to die in your car.” It is very specific and I can back that data up.
That’s great, but what about that drive to the airport?
A drive to the airport is a big deal to some, but how much safer is the flight than the drive to the airport? We need to work those previous numbers a little differently. Since we are talking about one particular drive (to the airport) we then need to compare the fatality rate on a drive-by-drive versus flight-by-flight basis, as opposed to overall fatalities per day. Let’s go into some detail on this one.
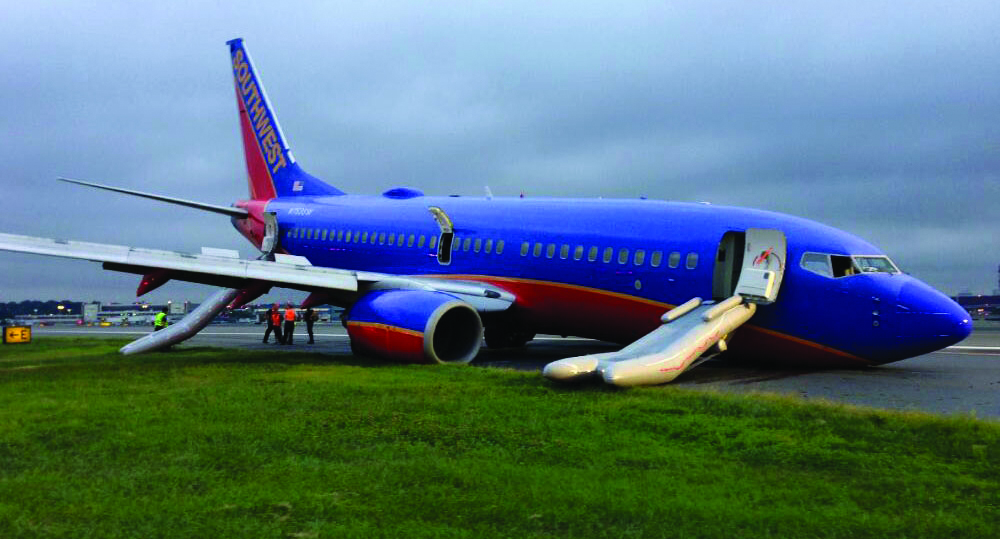
The Southwest Flight 375 accident at La Guardia Airport in 2013 caused no fatalities. Accidents do happen, but having a majority or all passengers walk away safely has become commonplace in our industry, thanks to advancements in procedure, technology and regulation.
The Federal Highway Administration says that the average person takes about 3 car rides (and some change) per day, which factors in all 318 million Americans, even those that do not drive. That is a total of 954 million car rides that take place daily.
There were 30,057 fatal accidents in 2013 (accidents, not people, since there can be more than one person per vehicle), which amounts to 82.3 of those 954 million rides ending in fatal accidents. Or, that is one fatal accident for every 11,591,737 rides.
For flights, there were 9,706,909 flights in 2013, and one fatal accident (Asiana Flight 214). No math needed to determine that ratio.
So by that perspective, if you drive to the airport, you are 1.19% less likely to die on the way there than on your flight.
That makes the phrase false, albeit by a small margin. But, if you were to take comparable driving figures and compare it to any other of the last 5 years that had no fatal airline accidents, your calculator will of course be showing goose eggs in favor of air travel.
But, this is all assuming that “safe” means “not dying” in the words “most dangerous” of the original phrase. We can work all of these all over from the start figuring whether or are more likely to simply crash your car versus crash your plane (since survivability rates in both car and airliner vary greatly), or if you can look at actual injuries with the fatalities. The possible stats and subsequent phrases you can come up with are exponential. You get the idea.
Where we’re going, we don’t need roads
Let’s look at the future, and not only how those stats can change, but how the words you hear in the representation of those facts can be warped as well.
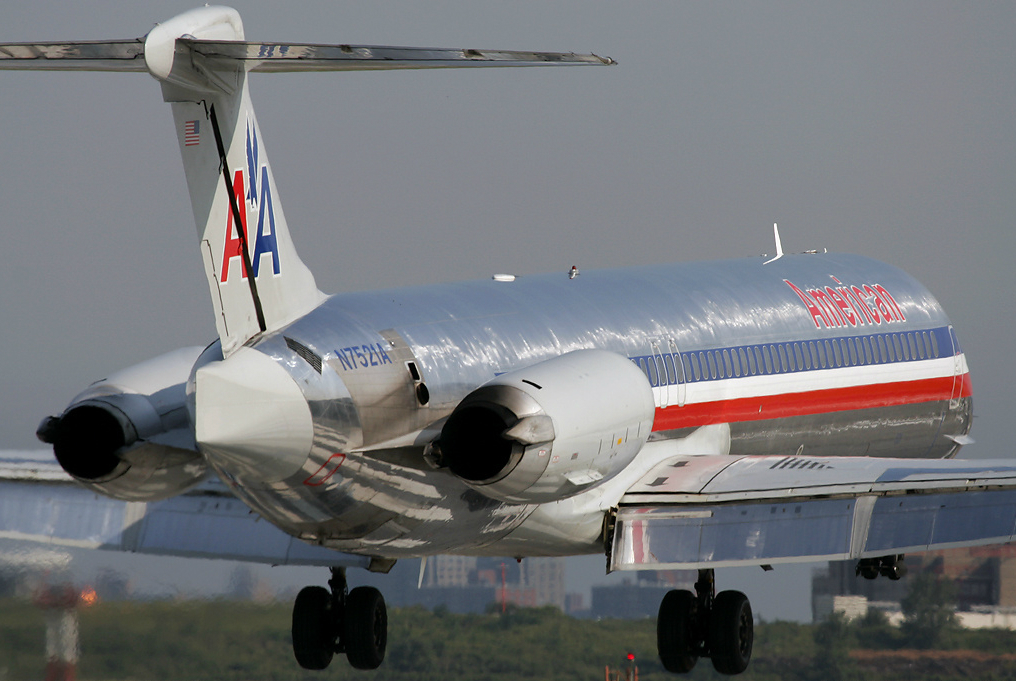
Moments from landing, completing another successful flight, which happens almost 26,000 times each day in the U.S. with nary an incident.
The average flight in the U.S. has 89 passengers. With one all-fatal crash at that passenger load in 2015, it would be only the fourth fatal airline crash in a decade. The daily airline fatalities would be miniscule, and the comparison of flying to driving would still be far apart in favor of air travel.
Regardless, seeing the headline “Worst Air Disaster of the Decade!” after such a wreck is not a stretch to expect to see from some news outlets. Technically, yes, that would be true, but it is terribly misleading. Need I explain why?
And there you have the most important ingredient, which is you, the viewer/reader. It is up to you to take what you are being fed and decide how you want to digest it. A flip through the channels will get you a ton of different headlines and information, and none of us should be so quick to trust that one particular source, without understanding how we got there. Ask questions, seek the truth, and a balance between all.
Only then, with a closer look, will you have a strong understanding of just how safe you really are when you take to the skies.
Phil Derner founded NYCAviation in 2003. A lifetime aviation enthusiast that grew up across the water from La Guardia Airport, Phil has airline experience as a Loadmaster, Operations Controller and Flight Dispatcher. He currently runs NYCAviation and performs duties as an aviation expert for the media. You can reach him by email or follow him on Twitter.